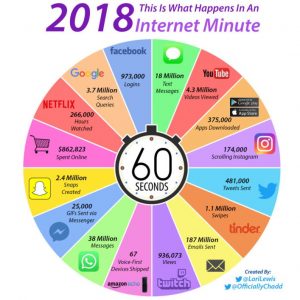
There is a lot of web traffic in an internet minute.The amount of information that people and systems create and pass through the internet is so enormous in any given day. This is because there is always an activity going on 24 hours a day as people communicate using emails, social media, and other Internet-based channels.
Other web traffic comes from searches, logins to various accounts and more. However, most of this traffic is from emails and WhatsApp messages followed by internet searches and social media interactions.
Below are some of the statistics to give you an idea of what happens in one internet month.
- 8,078,400,000,000 which is over 8 trillion email messages
- 1,641,600,000,000 or about 1.642 trillion WhatsApp messages
- 159,840,000,000 or about 160 billion Google searches
- 42,033,600,000 or over 42 billion Facebook logins
This is a lot of data; in fact, expressing this on annual basis will produce massive figures that we are not used to seeing and our minds may not even process properly. To help you understand this properly, below is the visualization of the average traffic in an internet minute.

Average web traffic in an internet minute
This includes apps downloaded, messages sent through various internet applications, hours spent watching movies, and images sent. In addition, there is the number of new accounts created and so on and so on. The internet minute visualization also includes the amount of money people spend shopping online.
As can be seen the average web traffic in one internet includes
- 187 million emails
- 18 million text messages
- 3 million YouTube videos viewed
- 7 million Google searches
- 4 million Snapchat
- 971K Facebook logins
- 481K twitter messages
- 266K netflix hours watched
- 67 Amazon Echo shipments
It is worth noting that this represents only the major media channels, social media networks, and other commonly used high traffic sites. As such, there is much more that is not included but still accounts for a considerable amount of web traffic.
For example, the internet minute visualization is only representing Google searches whereas there are other search engines such as Bing, Ask, Duckduckgo and others which also have their share of traffic. Similar, there are many other social media sites and applications which have not been captured.

The web traffic is always on an upward trend every year as we can see from the visualization for the year 2017.